


Six green dashboards. Zero fewer incidents.
That’s the quiet failure mode of modern startup security reporting—and most founders don’t spot it until a deal stalls or a weekend blows up.
Keep guessing, and you pay in lost trust, longer sales cycles, and late-night firefights that never make it into the deck. This guide shows how to run security metrics for founders the way you run product: with eight operational indicators that reveal exposure, speed, resilience, and debt—without a full SOC or a metric graveyard.
You’ll see which cybersecurity metrics actually move decisions, how to read trends instead of snapshots, and where SOC 2 and NIST CSF expectations quietly map to real operations. If you need the budget side of that conversation, pair this with a practical SOC 2 budget calculator for startup planning.
The Strategy: Use trendlines, age buckets, and owners instead of theatrics to shorten diligence cycles and reclaim leadership time.
The Goal: Measure whether business risk is decreasing over time—not just whether policies exist.
Read this like an operator • Steal the parts that force decisions • Ignore anything that doesn’t
Table of Contents
1) Start Here: What “Good” Looks Like for Founder Metrics
Outcome first: metrics that reduce business risk, not vanity charts
A good founder dashboard answers one question: Are we safer than last month in ways that matter to revenue, uptime, and trust? If your metrics can’t change staffing, tooling, roadmap, or escalation decisions, they’re mostly decoration. Security becomes operational when it behaves like product: clear goals, clear owners, and trend-based learning.
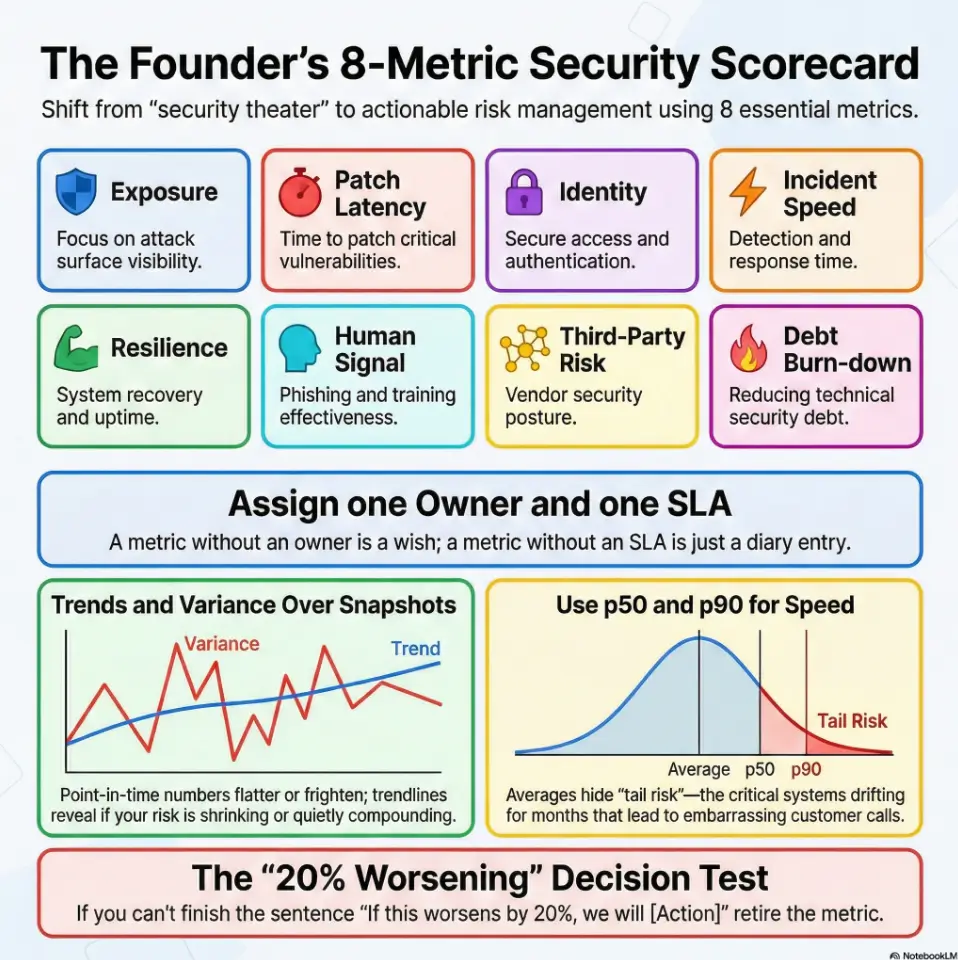
The 8-metric rule: why fewer metrics create better decisions
Eight is not magic; it’s practical. Fewer than five and you miss blind spots. More than ten and meetings become archaeology. The eight in this guide cover exposure, speed, resilience, behavior, partners, and debt. That spread is broad enough for reality, narrow enough for leadership focus. In one seed-stage company I advised, cutting from 27 KPIs to 8 reduced meeting time by 42 minutes and increased action completion in two sprints.
Let’s be honest… if a metric can’t change a meeting decision, drop it
Here’s the test: for each metric, write one sentence beginning with “If this worsens by 20%, we will…” If you can’t finish the sentence, retire the metric. Founders are time-poor. The board is time-poor. Your security lead is very time-poor and probably drinking cold coffee.
- Measure risk outcomes, not compliance busyness.
- Keep the dashboard compact (around 8 metrics).
- Tie each metric to a trigger and owner.
Apply in 60 seconds: Pick one current KPI and write the “If this worsens, we will…” sentence.
Eligibility checklist (Money Block)
Use this binary pre-check before building a dashboard:
- Yes/No: We can inventory internet-facing assets weekly.
- Yes/No: Each metric can name one owner and one escalation path.
- Yes/No: We can produce month-over-month trendlines for at least 90 days.
- Yes/No: We can separate critical/high from medium/low data.
- Yes/No: Leadership will review this in a fixed cadence (weekly or monthly).
If you answered “No” to 3 or more, start with 3 metrics first, then scale. Neutral next step: assign one person to close one “No” this week.
2) Metric #1: Critical Exposure Now (Open Critical/High Findings)
What to count: internet-facing assets, critical vulns, misconfigurations
Count what can hurt you this week: internet-facing critical/high vulnerabilities, exposed services, dangerous cloud misconfigurations, and identity misconfigurations with privileged access impact. Don’t mix “known but accepted risk” with “newly discovered and untriaged” in one bucket. That blend hides urgency.
Thresholds that trigger action (not panic)
Use a simple threshold ladder. Example: critical internet-facing findings above 0 require same-day triage. Critical above 3 triggers leadership escalation. High findings older than 30 days trigger backlog intervention. Keep it boring and explicit. Calm systems beat heroic improvisation.
Open loop: the hidden “aging finding” pattern your dashboard may miss
Most teams track “how many open.” Fewer track “how old and where stuck.” Aging findings are often coordination failures, not technical mysteries. One team I worked with saw open critical count remain flat for two months. Looked okay. Then we sliced by age and learned 67% were over SLA because dependency owners changed during a reorg. If your teams are still defining service windows, a detailed vulnerability remediation SLA playbook can make those escalation thresholds operational instead of aspirational.
Show me the nerdy details
Prefer two views: (1) open critical/high by asset class, (2) age buckets (0–7, 8–30, 31–60, 60+ days). Add a “stuck reason” tag: dependency, false positive dispute, change-freeze, owner unavailable, tooling gap.
3) Metric #2: Patch Latency Trend (Time to Remediate by Severity)
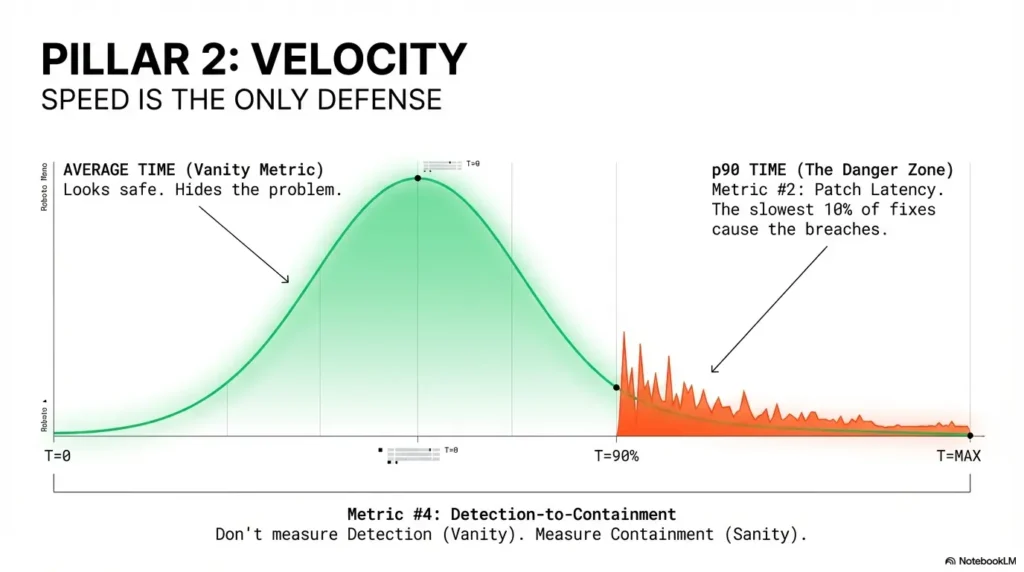
Why “average patch time” lies without percentile view
Averages hide pain. If one small group patches fast while one critical system drifts for 90 days, your average can still look “fine.” That’s why founder dashboards should use p50 and p90. The p50 shows typical performance. The p90 reveals tail risk—the stuff that becomes incident retrospectives and awkward customer calls.
Use p50/p90 remediation time to reveal bottlenecks
Track by severity and surface type. Critical cloud misconfigs might close in 3 days at p50 but 28 days at p90. That gap often points to approvals, maintenance windows, or ownership ambiguity. In one Series A SaaS, the p90 dropped from 41 to 14 days just by defining change windows in advance.
Don’t do this: mixing endpoint patching with cloud misconfig fixes in one KPI
Different workflows, different blockers, different risks. Keep at least two streams separate: endpoint/server patching and cloud/control-plane misconfig remediation. If you merge them, you can’t tell whether the bottleneck is IT ops, platform, or application engineering. The same “separate workflows by risk class” logic appears in penetration testing vs vulnerability scanning, where blended reporting often hides actionability.
- Use p50 and p90 by severity.
- Separate endpoint and cloud remediation.
- Track blockers as first-class data.
Apply in 60 seconds: Add one column to your report: “p90 critical remediation days.”
Mini calculator (Money Block)
Inputs (3): Open critical findings, average business impact score (1–5), and median days open.
Output (2 lines): Exposure Pressure = findings × impact × days. If score rises 2 months in a row, pause new feature debt for one sprint.
Neutral next step: run this once with today’s data and compare to last month.
4) Metric #3: Identity Hardening Rate (MFA + Admin Surface)
Measure privileged-account MFA coverage separately from workforce MFA
95% workforce MFA can coexist with a single weak privileged path that ruins your week. Track privileged coverage separately, with stricter targets. For most startup environments, privileged MFA should be treated as near-mandatory with exception logging and expiry dates.
Admin sprawl index: how many standing privileged accounts exist
Count standing privileged accounts and track trend direction. If the number creeps upward each month, your blast radius is quietly growing. Healthy teams reduce standing privilege and shift to just-in-time elevation where possible. Not perfect? Fine. Better each month? That’s the point.
Open loop: one orphaned admin path can erase 95% coverage optics
I once joined a quarterly review where identity metrics looked excellent—until we found an old admin account tied to a deprecated integration. It still had broad permissions. Nobody owned it. No one had logged in for months. That single orphan turned a “green” dashboard into a very human moment of silence. Orphaned privilege paths are also common in low-level hardening gaps like unrestricted sudo NOPASSWD privilege escalation patterns and legacy service issues such as unquoted service path vulnerabilities.
Show me the nerdy details
Track: privileged MFA %, number of standing privileged identities, number of orphaned identities, and average age of elevated permissions. Add monthly attestation completion for critical groups.
5) Metric #4: Detection-to-Containment Time (MTTD + MTTC)
Why detection speed without containment is false confidence
Fast detection is great. Fast detection with slow containment is expensive theater. Keep MTTD and MTTC side by side and discuss them together. If one improves while the other worsens, celebrate later. Diagnose now.
Segment by incident class (phishing, endpoint, cloud, identity)
Incident families behave differently. Phishing containment may be measured in minutes; cloud identity misuse can take hours or days to fully isolate. Segmenting by class prevents one incident type from masking another’s operational weakness.
Here’s what no one tells you… tabletop wins often fail in live incidents
Tabletops are useful, but reality includes fatigue, cross-team latency, and missing context. One team ran a flawless tabletop in 45 minutes, then took 9 hours in a live incident because alert ownership was unclear on weekends. Your metric should reflect live operations, not rehearsal confidence.
- Track MTTD and MTTC together.
- Segment by incident class.
- Review weekend/on-call differences.
Apply in 60 seconds: Add a row to your dashboard: “MTTC (weekend) vs MTTC (weekday).”
Decision card (Money Block)
When A vs B
- A: Weekly incident metric review if you had 2+ P2/P1 incidents in last 30 days.
- B: Monthly review if incident volume is low and MTTC trend is stable for 90 days.
Time/cost trade-off: Weekly review costs leadership attention now, but cuts surprise costs later.
Neutral next step: choose A or B explicitly and put it on the calendar.
6) Metric #5: Recovery Confidence (Restore Success + RTO Reality)
Backup success is not restore success—track both
“Backups succeeded” is comforting, but incomplete. Recovery confidence comes from successful restores under realistic conditions. Track scheduled restore tests, success rates, and failed restore root causes. If restore tests are skipped, confidence is imaginary.
Test restore time vs promised RTO; log variance
Most teams have promised RTO values in contracts or internal docs. Measure actual restore times against those promises and log variance monthly. Variance is not failure; it’s a map. You can’t improve what you politely avoid measuring.
Curiosity gap: can your team restore on a Friday night without the “one hero”?
If recovery depends on one person’s memory, that is operational debt in disguise. I’ve seen teams restore perfectly on Tuesday afternoons with the full cast, then struggle on late-night pages because one runbook step lived only in someone’s head. Write it down. Rehearse it. Reduce heroics. If you need a format baseline for repeatable evidence, start from a structured pentest report template and adapt restore-test sections to your ops cadence.
Show me the nerdy details
Track at least: restore success %, median restore duration, p90 restore duration, variance vs RTO, and “single-person dependency present” yes/no. Include quarterly game-day outcomes.
7) Metric #6: Human-Risk Signal (Behavior, Not Checkbox Training)
Track repeat clickers, report rates, and privileged-user error patterns
Completion rate is compliance-friendly, but behavior metrics predict operational risk better. Measure repeat risky behavior, suspicious-report rates, and incident-prone patterns among privileged users. Focus on coaching and friction reduction, not blame.
Move from completion rate to risk-reduction indicators
Practical examples: % of reported suspicious messages within 15 minutes, repeat clicker trend, and admin-policy exceptions by team. These reflect detection culture, not course completion theater. One small B2B team improved report rates from 18% to 47% in three months after adding one-click reporting and manager nudges.
Don’t do this: celebrating 100% training completion with rising incident volume
That mismatch is common and fixable. Training that doesn’t shift behavior is content, not control. Use behavior telemetry to tune training frequency, scenario relevance, and privileged-role support. Quietly useful beats loudly complete.
- Track repeat risky actions over time.
- Measure reporting speed and quality.
- Coach privileged users differently from general workforce.
Apply in 60 seconds: Replace one “completion” KPI with one “behavior trend” KPI this month.
8) Metric #7: Third-Party Risk Closure (Vendor Findings to Resolution)
Count unresolved critical vendor gaps by data sensitivity tier
Founders often underestimate supplier-side exposure until procurement or due diligence week. Track unresolved critical findings for vendors handling sensitive data, and tier vendors by sensitivity and integration depth. Your largest exposure path may not be your codebase.
Measure days-to-closure after assessment
Assessment completion is not closure. Track median days-to-closure and aging exceptions for critical vendors. Tie exception renewals to explicit risk acceptance with end dates. If risk acceptance has no expiry, it’s usually just deferral in formal clothing. And when third-party testing language is vague, tighten contracts with a clear penetration test SOW template and explicit pentest limitation-of-liability clauses.
Open loop: your biggest breach path may be outside your stack
I remember a founder who said, “Our app is clean, we’re good.” They were disciplined internally—but one third-party workflow had broad access and weak controls. No incident occurred, thankfully, but the near miss changed their vendor program overnight.
Coverage tier map (Money Block)
Tier 1: Public data vendors — annual review.
Tier 2: Internal operational data — semiannual review.
Tier 3: Customer-sensitive data — quarterly control verification.
Tier 4: Privileged integration / identity impact — quarterly + targeted control tests.
Tier 5: Business-critical + sensitive data + privileged access — continuous monitoring + executive review.
Neutral next step: assign top 5 vendors to tiers this week and time-box unresolved critical gaps.
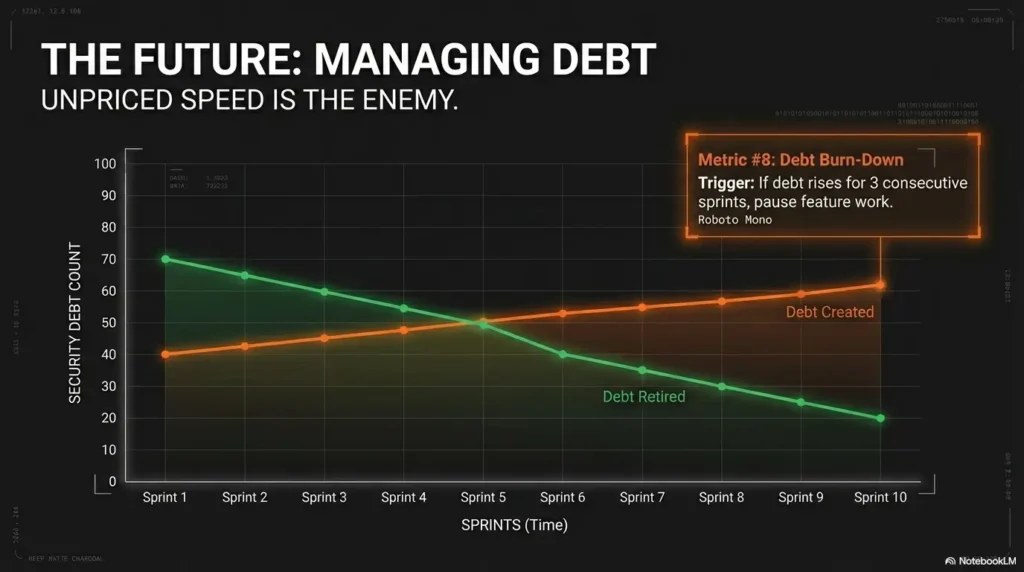
9) Metric #8: Security Debt Burn-Down (Backlog Health)
Define security debt categories: code, cloud, identity, process
Security debt is anything known, accepted for now, and risky if left untreated. Group debt into code, cloud, identity, and process. This keeps debt discussion concrete and avoids the “everything is priority” trap.
Burn-down ratio: debt created vs debt retired per sprint
Your ratio tells the story. If debt created outpaces debt retired for 2–3 sprints, future incident probability and cleanup cost both rise. Founders understand compounding in finance; security debt compounds similarly, just with surprise invoices from reality.
Pattern interrupt: “fast shipping” is expensive when debt compounds silently
Speed is not the enemy. Unpriced speed is. In one startup sprint, we shipped a big release and deferred several auth hardening tasks. Delivery felt excellent for two weeks. Then we spent 10 engineer-days in cleanup and customer responses after a preventable issue. That ratio was the red flag we ignored. Teams that run cleaner remediation loops often standardize evidence collection too—for example, disciplined screenshot naming patterns for security proofs and repeatable lab logging habits to reduce rework.
Show me the nerdy details
Track debt created vs retired per sprint, debt age distribution, and debt interest indicator (incidents/issues linked to known debt). Add sprint-level “security capacity reserved %” for predictability.
Founder Security Progress Scorecard (One-Page Infographic)
1) Open Critical/High
2) Patch Latency (p50/p90)
3) Privileged MFA + Admin Sprawl
4) MTTD + MTTC by class
5) Restore Success + RTO Variance
6) Behavior Risk Trend
7) Vendor Gap Closure Time
8) Security Debt Burn-Down
Weekly owner review
Monthly leadership trend review
10) Who This Is For / Not For
For: seed-to-Series C SaaS, fintech, healthtech, B2B platforms with customer security reviews
If your team gets security questionnaires, enterprise trust reviews, or investor diligence questions, this dashboard is for you. It helps translate technical drift into business language. It also helps engineering and leadership align without an interpretive dance.
Not for: teams needing full regulatory legal interpretation as first priority
If your immediate challenge is legal interpretation of regulations, involve qualified legal counsel first. Metrics are operational tools, not legal opinions. This framework helps run the program; it does not replace legal review for regulated obligations.
If you’re pre-product: start with 3 leading metrics before adopting all 8
Pre-product teams can start with: critical exposure now, privileged MFA coverage, and restore confidence. Keep it lean, prove rhythm, then expand. The win condition is operational consistency, not metric quantity.
11) Common Mistakes Founders Make with Security Metrics
Mistake #1: Reporting only compliance activity, not risk outcomes
“We completed training” and “we uploaded evidence” are not useless—but they’re not outcome metrics. Pair activity with risk trend. Otherwise you’re tracking motion, not progress.
Mistake #2: One blended KPI for all severities and systems
Blended metrics hide priorities. Separate critical/high from medium/low, and separate surface types when workflow differs. Precision beats prettiness.
Mistake #3: Monthly snapshot reporting without trend and variance
Point-in-time numbers can flatter or frighten randomly. Trends reveal direction. Variance reveals process reliability. Without both, decisions are guessy.
Mistake #4: No owner, no SLA, no escalation path per metric
Unowned metrics decay. A metric without an owner is a wish. A metric with an owner but no SLA is a diary entry. A metric with owner + SLA + escalation becomes a management tool.
Mistake #5: Optimizing for investor optics instead of incident readiness
Optics can buy one smooth meeting. Readiness protects the next twelve months. Investors, customers, auditors, and your future sleep schedule all prefer the second one.
- Pair activity with outcome trends.
- Assign owner + SLA + escalation for every metric.
- Review direction and variance, not snapshots alone.
Apply in 60 seconds: Add owner initials and SLA days next to each metric in your deck.
Short Story: The green dashboard that wasn’t (120–180 words)
Short Story: A founder sent me a dashboard that looked immaculate—green everywhere, trend arrows politely angled upward. We celebrated for about six minutes. Then we asked one annoying question: “Show us the age of critical findings and who owns each one.” The room got quiet. Their open critical count was low, yes, but three of those findings were older than 45 days, each blocked by “dependency unclear.”
Meanwhile, a tabletop report said incident handling was strong. Live incident data said containment slowed sharply on weekends. None of this was catastrophic. All of it was fixable. They didn’t need new tools; they needed tighter ownership and one ruthless rule: no metric enters the board deck unless it can trigger a specific decision. Ninety days later, their dashboard looked less pretty, more honest, and dramatically more useful. That’s when security stopped being performative and started being operational.
FAQ
Which security metrics matter most for early-stage startups?
Start with three: critical exposure now, privileged MFA coverage, and detection-to-containment time. These reveal immediate risk, identity resilience, and incident readiness without requiring a large team.
How often should founders review security metrics—weekly or monthly?
Weekly for owner-level execution and blocker removal. Monthly for leadership trend review and budget/resource decisions. If incident volume spikes, temporarily move leadership review to weekly.
What’s a good target for patching critical vulnerabilities?
Targets vary by environment and customer commitments, but a practical pattern is same-day triage and short closure windows for internet-facing critical issues. More important than any single number: track p90 and aging exceptions visibly.
Is compliance evidence the same as security performance?
No. Compliance evidence shows that controls exist and are documented. Security performance shows whether risk is actually reducing in operations. You need both, but they answer different questions.
How do we measure security if we don’t have a full SOC team?
Use a lean scorecard and automate collection where possible from existing tooling (ticketing, identity platform, vulnerability scanner, backup reports). The goal is consistent trend visibility, not perfect completeness on day one.
Which metric best predicts breach likelihood?
No single metric predicts breaches perfectly. A combined view works better: unresolved critical exposure, privileged identity hygiene, and containment speed. When all three worsen together, risk generally rises meaningfully.
Should board decks include trendlines or point-in-time snapshots?
Include both, but prioritize trendlines with variance notes. Snapshots are context; trends are direction. Boards make better decisions when they can see whether issues are compounding or being retired.
How do we benchmark security metrics against peers?
Benchmark carefully by company stage, architecture, and risk profile. External comparisons can guide ambition, but internal trend improvement over 2–3 quarters is usually the strongest decision input for founders.
Can we automate these metrics with existing tools?
Usually yes. Most teams can automate 60–80% through existing systems: ticketing for remediation times, identity platform for MFA/admin counts, incident tooling for MTTD/MTTC, and backup logs for restore outcomes.
What should we do first if our metrics are getting worse?
Freeze dashboard expansion, define owners and SLAs, and run a 30-day stabilization sprint focused on the two worst trends. Improvement starts with scope discipline and clear accountability, not more charts.
13) Next Step: One Concrete Action (Do This This Week)
Build a one-page “Security Progress Scorecard” with these 8 metrics
Keep it to one page. Put trend arrows, age buckets, and blocker notes. If a metric is green but aging exceptions are rising, flag it amber. Honesty beats aesthetics.
Assign one owner and one SLA per metric
Owner names create momentum. SLAs create timing discipline. Escalation paths create continuity when priorities collide. Without all three, you’ll still be arguing about definitions in month three.
Review trend + blockers in the next leadership meeting (30 minutes)
Use a fixed agenda: 10 minutes trends, 10 minutes blockers, 10 minutes decisions. End with exactly three commitments and dates. That cadence closes the loop from the hook: security stops being a fog machine and becomes a managed operating system.
For practical control language and implementation references, teams often align operating models with NIST CSF categories and incident handling guidance from CISA, then map evidence to SOC 2 trust criteria expectations during due diligence cycles. If you need to connect program metrics to offensive validation, this is where a realistic penetration testing cost model and a clear security findings report structure help leadership make cleaner trade-offs.
- Eight metrics are enough for founder decisions.
- Trend + owner + SLA beats point-in-time perfection.
- Operational honesty compounds into trust.
Apply in 60 seconds: Schedule a 30-minute scorecard review for next week and send the agenda now.
Last reviewed: 2026-02.