
At 2:13 a.m., my “toolkit” finally ran end-to-end
Build a Mini Exploitation Toolkit in Python
That’s the real pain: scripts that “work” once, outputs that don’t match twice, and a creeping fear you’re one typo away from an off-scope mistake. Keep guessing and you pay in reruns, missing evidence, and fragile confidence.
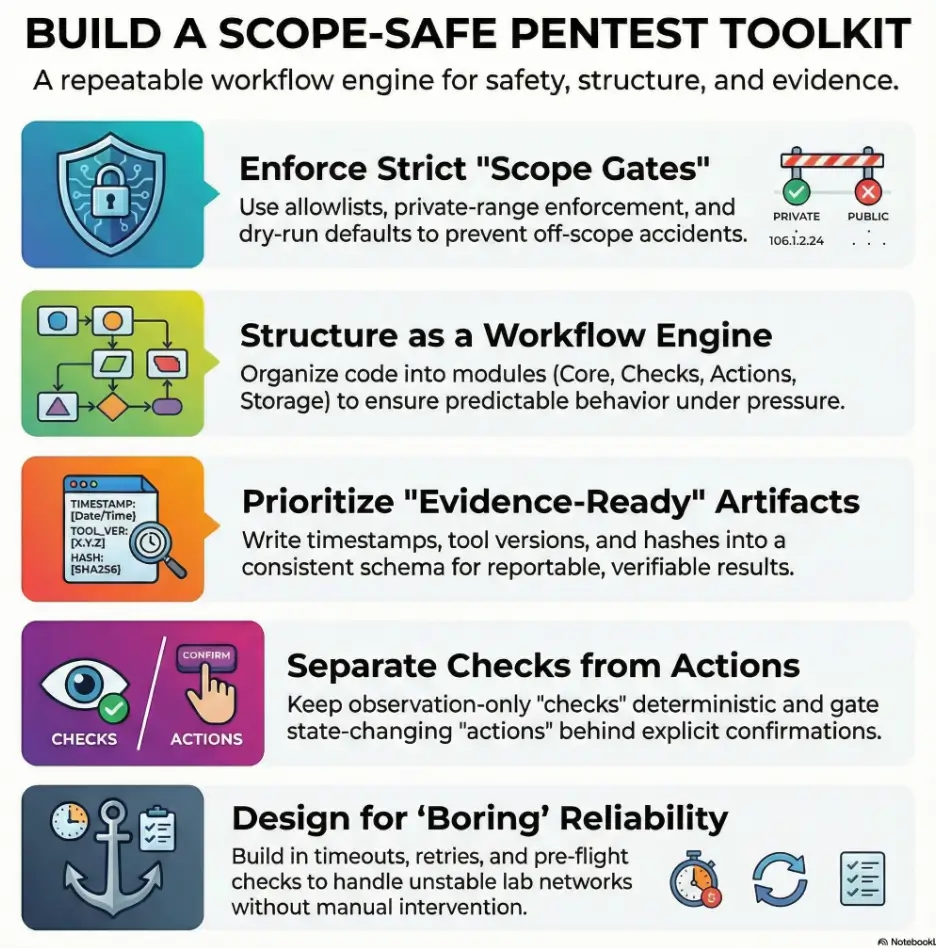
A mini exploitation toolkit is a scope-safe workflow engine: it validates targets, gates actions behind dry-run confirmations, and writes evidence-ready artifacts into a consistent results schema.
The Core Components: Scope files, dry-run defaults, run folders, correlation IDs, and “boring” reliability under weird lab networks.
Let’s start where most people skip—scope, outputs, and receipts.
A mini exploitation toolkit isn’t about “more exploits”—it’s about a repeatable, reportable, scope-safe workflow you can run without panicking. The fastest path is building a modular CLI, target validation (allowlist + “no public IPs” defaults), clean logging, and evidence-ready outputs. Start with a skeleton (config, results schema, storage, recon wrappers), then add lab-only actions behind dry-run + explicit confirmations.
Table of Contents
Safety / Disclaimer (read once, then build)
This article is for authorized labs/CTFs or explicit written permission only. No targeting public IPs, real companies, or third-party systems. If you’ve ever felt the temptation to “just see what happens,” that’s the exact moment to step back. Building tooling is power—and in the US, authorization is the line that keeps you safe, employable, and credible.
The safest mini exploitation toolkit is boring in the right places: it has an allowlist, dry-run mode, and explicit confirmations. It stores minimal artifacts, redacts what it can, and makes it hard to do the wrong thing by accident. If you’re working inside an organization, follow your rules of engagement and talk to your security lead or legal team early. NIST’s SP 800-115 is a useful, plain-language reference for how professional testing is framed and documented. If you’re still building your environment, start with a safe hacking lab at home checklist so your practice stays clean and clearly authorized.
- Default to allowlists and dry-run
- Log actions like you’ll need to explain them later
- Minimize artifacts and never store secrets by default
Apply in 60 seconds: Create a scope.yml file with one lab host and refuse everything else.
When to seek help (stop, escalate, document)
- Scope is unclear: pause and get written clarification.
- You see real user data: stop collection and escalate per your engagement rules.
- You find a critical exposure: follow the disclosure/escalation path immediately.
- Your tool behaves unpredictably: disable “actions,” preserve logs, and reproduce safely.
Who this is for / not for
If you’re time-poor, learning fast, and building lab runs you can repeat on demand, you’re in the right place. If you’re hoping a “toolkit” is a shortcut that replaces fundamentals, you’ll hate this post—because we’re building a workflow, not a magic wand.
- For: OSCP-style learners doing focused prep, defenders validating detections, CTF builders, junior pentesters who want clean evidence.
- Not for: “try it on the internet” curiosity, gray-area testing, revenge debugging, anything without permission.
- Prereqs: basic Python, networking basics, and a lab you own or are authorized to test (think Hack The Box, TryHackMe, a local VM lab, or an internal range).
Quick honesty moment: my first lab weekend, I “knew Python,” but I didn’t know how to make Python behave under pressure. That’s why this guide leans hard into guardrails, logging, and boring reliability.
- Yes/No: Do you have written permission or an explicit lab/CTF agreement?
- Yes/No: Is your target list restricted to private ranges or known lab hostnames?
- Yes/No: Can you describe your scope in one sentence?
- Yes/No: Can you store outputs without collecting sensitive real-world data?
Next step: If any answer is “No,” fix that before you write a single line of tooling code.
Toolkit-first mindset: workflow beats “more exploits”
Here’s the mental shift that changed everything for me: a mini exploitation toolkit is a workflow engine. It’s not a trophy cabinet of tricks. A good toolkit helps you do four things calmly: run checks, stay in scope, capture proof, and repeat the run tomorrow without re-learning your own code.
In practice, that means your toolkit is built around verbs: recon, validate, record, and (only if appropriate in your lab) execute a narrowly scoped action. If you’ve used tools like pwntools, essential Kali Linux tools, or Metasploit in labs, you’ve felt this difference: the best tools guide you into safe, repeatable behavior.
Define the boundary: “checks” vs “actions” vs “proof”
- Checks: observation-only steps (scan, fingerprint, parse, validate).
- Actions: steps that change state (even in a lab). These must be gated.
- Proof: the minimal evidence that a result is real (logs, hashes, captured outputs).
Curiosity gap: the quiet reason most toolkits fail
Most toolkits fail because they can’t be trusted twice. The first run feels fine. The second run produces different output, missing context, or a mystery error. That’s not “learning”—that’s your toolkit quietly lying to you. The fix starts with structure.
Show me the nerdy details
“Trust” in tooling is usually three things: deterministic inputs, consistent parsing, and stable dependencies. In labs, the world still changes (ports open/close, services restart), but your code shouldn’t add randomness on top. Capture tool versions, normalize outputs, and separate raw artifacts from summarized findings so you can re-run with confidence.
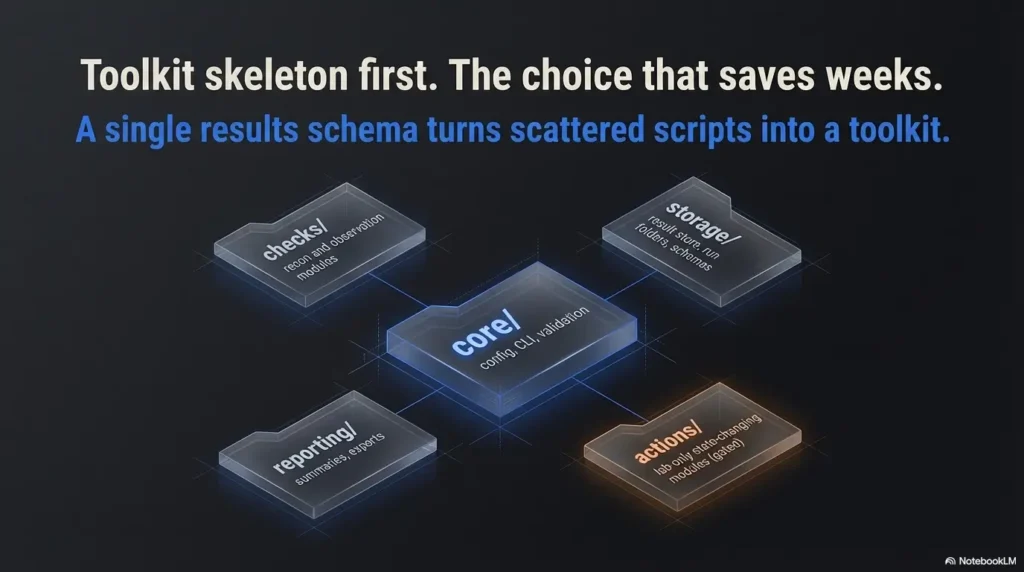
Toolkit skeleton first: the architecture choice that saves weeks
The best day to choose your structure is before you write your second script. My early mistake was building “one-off wins” that couldn’t share outputs. That felt fast—until I wanted a report-like summary and realized each script spoke a different dialect.
Folder map: a simple, durable layout
core/— config, CLI, validation, shared utilitieschecks/— recon and observation modulesactions/— lab-only state-changing modules (gated)storage/— result store, run folders, schemasreporting/— summaries, exports, human-readable views
CLI contract: subcommands that match a workflow
A clean CLI makes a toolkit feel professional instantly. Not because it’s fancy—because it’s predictable. Think: toolkit scope, toolkit check, toolkit run, toolkit report. When you’re tired, predictability is safety. If your terminal setup fights you, steal a few wins from this Zsh setup for pentesters guide so your workflow stays fast and readable under pressure.
Let’s be honest—your first “toolkit” is just a folder with opinions.
Mine certainly was. The cure is choosing one output model and forcing everything to speak it.
- Every module returns structured data
- Raw artifacts are stored separately
- Reports read the same schema every time
Apply in 60 seconds: Draft a result.json shape with fields for target, timestamp, tool, status, and evidence pointers.
Guardrails before horsepower: allowlists, dry-run, confirmations
This is where a “learning project” becomes a safe operator tool. Guardrails aren’t a lecture. They’re a design feature that prevents the single worst lab mistake: accidentally pointing your curiosity at something you don’t own.
Scope file design: allowlist + denylist + named environments
Use a scope file that is boring and strict. Allowlist hostnames, IPs, or CIDRs that are explicitly lab-bound. Add a denylist for “never touch” patterns. Give each scope a name and make the user type it to proceed.
Target validation chain: resolve → classify → allowlist match → proceed
- Resolve: convert hostnames to IPs and keep both in output.
- Classify: detect public vs private ranges and refuse public by default.
- Match: confirm target is in allowlist (hostname or IP/CIDR).
- Proceed: only after explicit confirmation.
Dry-run mode: show exactly what would run, then exit
Dry-run is your “seatbelt.” It prints the resolved targets, the commands that would execute, and the run folder where outputs would go—then stops. The first time you catch a mis-typed hostname in dry-run, you’ll never skip it again.
- Tier 1: Hard allowlist only (single host)
- Tier 2: Allowlist + private-range enforcement
- Tier 3: Tier 2 + dry-run default + confirmation gate
- Tier 4: Tier 3 + rate limits + strict timeouts
- Tier 5: Tier 4 + artifact minimization + redaction rules
Next step: Pick a tier and implement it before adding any “actions.”
Recon wrappers that don’t waste time
Competitors often stop at “here’s a library” or “here’s a command.” In real lab work, the pain is everything around that: timeouts, output normalization, and caching so you don’t repeat the same scan five times because you forgot where you saved it.
Subprocess vs library: choose based on truth, not vibes
Subprocess wrappers can be great when a tool already exists and outputs structured formats (like JSON or XML). Libraries can be better when you need fine control and stable objects. The best answer is often “both,” but behind one consistent interface.
| Choose | When it wins | Time/cost trade-off |
|---|---|---|
| Subprocess | Tool exists, outputs structured data, you need speed | Fast build; parsing and portability cost later |
| Library | You need control, reuse, and stable objects | Slower build; cleaner long-term maintenance |
Next step: Pick one recon task and implement both approaches on paper before coding.
Structured output first; regex last (and only with tests)
- Prefer JSON/XML outputs when available.
- Store raw output as an artifact, then parse into your schema.
- Write a tiny test set of “known outputs” from your lab.
Curiosity gap: the caching mistake that makes results quietly stale
The trap is caching without recording context. If you cache “scan results” but don’t store the tool version, command flags, and timestamp, your cache becomes a confident liar. Cache only when you can prove what produced it. If you want a repeatable pattern that won’t waste your nights, borrow a baseline from this fast enumeration routine for any VM and adapt it to your schema.
Parsing + normalization: the tiny shortcut that corrupts results
Parsing is where “I ran it” becomes “I can defend it.” My early shortcut was treating output as “good enough” for eyeballing. Then I tried to compare runs and realized I couldn’t. Same target. Same lab. Different formatting. Different assumptions. Chaos.
Normalize timestamps, target identity, tool versions, evidence pointers
- Target identity: store hostname + resolved IP + any ports/protocols tested.
- Time: store run start/end and module timestamps in a consistent format.
- Tool versions: record versions for major external tools (even in labs).
- Evidence pointers: store paths/hashes to raw artifacts, not the entire raw blob.
Keep raw artifacts separate from summarized findings
Your schema should point to artifacts, not absorb them. That keeps your “reportable view” small, readable, and safe to share—while raw data stays quarantined in a run folder.
Curiosity gap: the 5-minute parsing shortcut that ruins reproducibility
The shortcut is parsing “just the parts you need right now.” It works until you need one extra field and have to rerun everything. Parse a stable baseline of fields you’ll always need: identity, timing, status, and evidence pointers.
Show me the nerdy details
Normalization is less about making everything pretty and more about making comparisons possible. If you can diff two runs and answer “what changed,” you can debug faster and write cleaner findings. A small, consistent schema also makes it easier to export to CSV, JSON Lines, or a simple HTML report later.
Logging + artifacts: evidence-ready by default
If you’ve ever tried to explain a finding to someone else and realized you couldn’t reproduce it, welcome to the club. Logging is the memory you wish you had when your brain is fried. The goal isn’t “log everything.” The goal is “log the truth.”
Log levels: debug vs evidence vs operator notes
- Debug: internal messages for you (errors, retries, parsing steps).
- Evidence: what you’d cite in a report (what ran, against what, result).
- Operator notes: short human notes (“service restarted,” “lab VM lag”).
Correlation IDs: every action traceable end-to-end
Add a run ID. Add a module ID. Add timestamps. The first time you have three parallel checks running and one fails, you’ll be glad you can trace the failure without guessing.
Artifact hygiene: hash, redact, minimize
Store raw output as artifacts, but be disciplined. Don’t store credentials. Don’t store tokens. Don’t store “screenshots because it’s easier.” In labs, it’s tempting to be sloppy—because it’s “not real.” The problem is habits travel. If you want your “evidence brain” to feel automatic, model your outputs on a professional OSCP report template style structure: minimal, attributable, and easy to defend.
Short Story: The night I learned “proof” is not the same as “data.” (120–180 words) …
I had a lab box that kept flipping between “vulnerable” and “not vulnerable” depending on my mood, which is to say: depending on how fast I ran my scripts. I’d run a check, see a promising string, and celebrate. Then I’d rerun it to capture a screenshot and… nothing. Cue panic. I opened my terminal history like it was a diary and realized I hadn’t saved the command flags or the raw output. Worse: I’d copied only the “interesting line” into a note.
In that moment, the finding stopped being a finding and became a story—one no one else could verify. That’s when I rebuilt my toolkit around run folders, correlation IDs, and artifact pointers. Not because it’s academic. Because it’s the difference between “I think I saw it” and “Here’s what happened.” When you start keeping operator notes for real, a simple note-taking system for pentesting keeps your evidence and your memory from drifting apart.
- Store raw artifacts separately
- Log the command, flags, and versions
- Keep a minimal summary schema for reporting
Apply in 60 seconds: Create a runs/ directory with timestamped folders and a run.json manifest.
Curiosity gap: the single log line that saved me when my tool “worked”… but didn’t
“Resolved target: X → Y (scope: approved).” That one line, printed before every module, prevented an embarrassing mistake when a hostname resolved to a different IP than I expected after a lab reset. It wasn’t dramatic. It was quietly life-saving.
Reliability under stress: timeouts, retries, and weird networks
Labs can be messy: VMs stall, services restart, VPNs hiccup. If your toolkit treats every hiccup as a fatal error, you’ll spend more time babysitting than learning. Reliability isn’t glamour—it’s momentum.
Failure taxonomy: know what failed before you “fix” it
| Failure type | What it usually means | What to do next |
|---|---|---|
| DNS/Resolve | Name doesn’t resolve, split DNS, typo | Stop early; verify scope + resolver |
| Connect/Timeout | Service down, firewall, VPN lag | Retry with backoff; mark unknown |
| Auth | Wrong creds, wrong protocol, lockouts | Stop; never brute or guess blindly |
| Parse | Output changed, locale, unexpected format | Save raw artifact; fix parser with tests |
Retry policy: when to retry vs when to stop
- Retry transient errors (timeouts, brief connect failures) with a short backoff.
- Stop on scope failure, public IP detection, or explicit denylist matches.
- Mark unknown when the environment is unstable and you can’t prove a result.
Preflight checks: dependencies, permissions, environment capture
Before running checks, validate the basics: required binaries exist, Python packages match expected versions, output directories are writable, and the scope file loads. It feels “extra” until it saves you 40 minutes of debugging a missing dependency. If SSH is part of your lab workflow, tighten your defaults with a Kali SSH hardening checklist so your access method stays stable (and your habits stay professional).
Here’s what no one tells you—most pentest time is exception handling.
The smoother your exceptions, the more time you spend learning the target instead of your own stack traces.
Use this to stop guessing and start planning. (No data storage—just a quick estimate.)
Estimated runtime: —
Next step: Use the estimate to choose timeouts and a sane concurrency before you run.
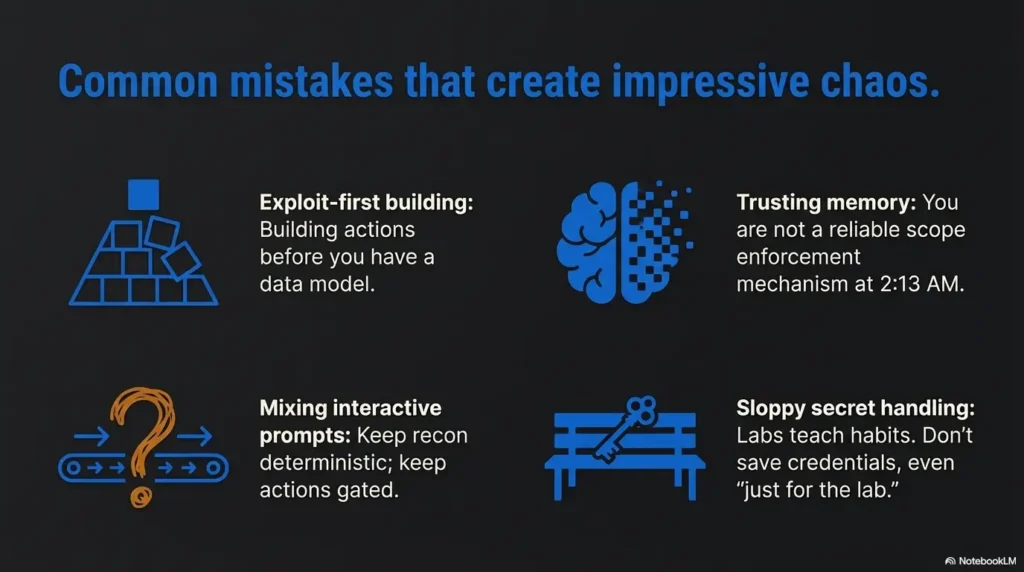
Common mistakes (and two “don’t do this” failures)
This is the section I wish someone had tattooed on my forehead before my first legal lab run. Most beginner pain is self-inflicted—not because you’re careless, but because you’re moving fast with zero guardrails. Let’s fix that.
Mistake #1: exploit-first building with no data model
If you build “actions” before you build outputs, you’ll end up with impressive chaos. You’ll get wins you can’t explain and results you can’t compare. Build the schema and storage first, then add capability.
Mistake #2: trusting memory instead of scope guardrails
You are not a reliable scope enforcement mechanism at 2:13 AM. Your code must be the adult in the room.
Mistake #3: mixing interactive prompts into automation paths
Interactive prompts belong behind explicit “action” commands, not sprinkled through recon. Keep recon deterministic; keep actions gated.
Mistake #4: saving credentials/tokens “just for the lab”
Labs teach habits. If you normalize sloppy secret handling, you’ll carry it into real work. Redact by default and store minimal proof.
Don’t do this #1: defaults that target broad ranges (even “for convenience”)
If your default is 0.0.0.0/0, it’s not a toolkit—it’s a liability generator. Your default should be “refuse unless explicitly allowed.”
Don’t do this #2: auto-running actions after recon without explicit opt-in
A recon module should never silently trigger state-changing behavior. Keep “actions” behind separate commands and typed confirmations.
Curiosity gap: the harmless-looking feature that turns a learning tool into a liability
“Auto-discover targets and test them.” It sounds helpful. It’s also the easiest way to drift out of scope. Auto-discovery belongs inside lab boundaries you can prove (a known range, a known inventory), not as a default behavior. When you’re choosing what to automate, sanity-check yourself against a curated pentesting tools list so you’re building workflow, not just collecting gadgets.
Show me the nerdy details
Good operator tooling forces explicitness: explicit targets, explicit scope, explicit action flags. The most mature tools don’t trust the operator’s memory; they validate, confirm, and record. That’s not paranoia. It’s professionalism.
FAQ
Is it legal to build an exploitation toolkit in Python in the US?
It can be, but legality hinges on authorization. Building software is not the same as using it against systems you don’t own. Stick to labs/CTFs with clear terms or written permission. If you’re working for a company, follow your rules of engagement and get explicit approval.
What’s the difference between a pentest lab, a CTF, and a real engagement?
Labs and CTFs are designed for practice and typically come with explicit rules and boundaries. Real engagements add legal agreements, scope documentation, stakeholder communication, and careful handling of sensitive data. Your toolkit should behave like it’s going to be audited—even if it never is.
How do I prevent accidentally scanning off-scope IPs?
Use an allowlist-by-default scope file, refuse public IP ranges, resolve hostnames and validate the resolved IP, and make dry-run the default mode. Add typed confirmation gates before any “action” steps.
What should a “report-ready” toolkit output look like?
Report-ready output is structured and minimal: target identity, what ran, when it ran, status/result, and pointers (paths/hashes) to raw evidence artifacts. It should be readable by both humans and scripts.
Should I use subprocess wrappers or Python libraries for recon?
Use subprocess wrappers when the tool already exists and produces structured output you can store and parse reliably. Use libraries when you need stable objects and fine control. Many toolkits use both—but they hide that behind one consistent interface.
What’s a safe way to store results locally during a lab?
Store each run in a timestamped folder with a small manifest file (run.json) and separate raw artifacts from summarized results. Avoid saving secrets and redact sensitive strings when possible. Keep artifacts minimal.
How do I test my toolkit so it doesn’t lie to me?
Build a small test set of known outputs from your lab. Save raw outputs and write parser tests against them. Re-run the same module twice and ensure you get consistent schema outputs, even if the target’s behavior changes.
What guardrails do professional teams use to reduce mistakes?
Strict scope enforcement, written runbooks, explicit confirmation gates for risky actions, rate limiting, timeouts, and evidence discipline. Many teams also align reporting and detection language with frameworks like OWASP guidance (for web testing) and MITRE ATT&CK (for describing techniques). If your toolkit will touch web surfaces, grounding your module choices in web exploitation essentials helps keep “checks” realistic and “actions” carefully contained.
Next step: one concrete action (today)
Here’s the fastest “ship it” path that still respects safety and quality. You’re going to build the skeleton and run it against one lab host. Not ten. One. Your job is to make it boring, repeatable, and evidence-ready.
The 15-minute plan
- Create a repo with
core/,checks/,storage/,reporting/. - Add
scope.ymlwith a single lab target. - Implement dry-run that prints resolved targets, commands, and output folder path.
- Create a timestamped run folder and write
run.json(manifest + correlation ID). - Add one recon wrapper that outputs structured data into your schema.
- Scope name + allowlisted targets
- Lab environment notes (VPN? local VM? cloud range?)
- Tool versions you’ll rely on (Python, key binaries)
- Timeouts and concurrency settings
- Where run folders will be stored
Next step: Fill this list once, then paste it into your run.json manifest.
Infographic: “Scope Gate” (printable mental model)
Operator rule: If any step fails, you stop. Not later. Now.
When you start wiring recon wrappers, pick one foundation and do it well—like an Nmap workflow in Kali Linux that you can repeat on Kioptrix—then normalize the output into your schema.
If you want a ready-made target ladder for practice, use a vulnerable machine difficulty map to choose one box that matches your current skill, and keep your scope file brutally narrow.
And if your “one lab host” is a Kioptrix box, pairing your run folders with a repeatable walkthrough (for example, a Kioptrix Level 2 walkthrough) makes it easier to compare “manual vs toolkit” results without fooling yourself.
Under weird networks, you’ll sometimes need to prove what happened on the wire—this traffic analysis with Wireshark in a Kioptrix lab style workflow fits perfectly with the “receipts” mindset.
If your toolkit will be used across different lab setups, capturing environment assumptions up front matters—especially if you’re rotating between VMs, VPN ranges, and home labs. This Kali Linux lab infrastructure mastery guide is a solid mental model for keeping those variables from quietly wrecking reproducibility.
Conclusion: ship the skeleton, keep your receipts
Remember the hook—my first end-to-end run felt like victory until I realized I couldn’t prove what happened. The fix wasn’t adding “more exploitation.” It was adding structure: scope guardrails, a stable results schema, evidence-ready logs, and reliability that doesn’t crumble when the lab gets weird.
If you do one thing in the next 15 minutes, do this: create a repo, add a scope file with one host, implement dry-run, and write a run manifest before anything executes. That’s how you turn a legal pentest lab into a skill you can repeat—and eventually, a workflow you can trust in real work. When you’re ready to expand beyond one box, keeping your targets organized through the Kioptrix levels directory helps you scale without losing control of scope.
Last reviewed: 2025-12-20